SIL Risk Graph Calculator
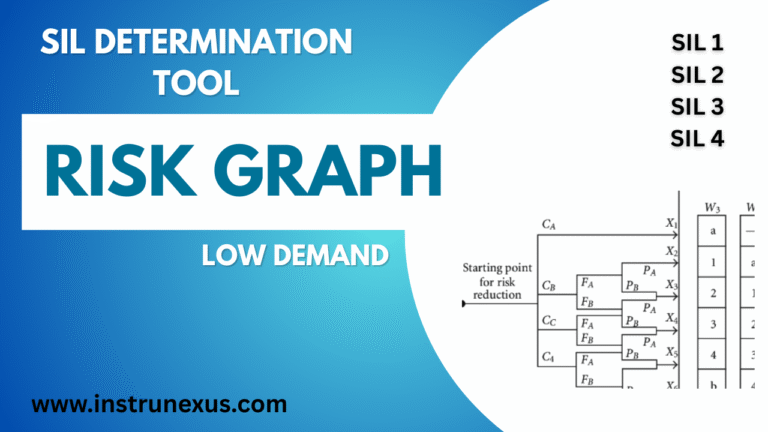
IEC 61508 C/F/P/W method. Choose levels and click Calculate to get the resulting SIL. (Orientation aid only; validate per your company's standard and the latest IEC 61508/61511.)
C: C1 — Slight injury
F: F1 — Seldom/short
P: P1 — Very low
W: W1 — Avoidable
Outcome: —
SIL: 0 (No specific requirement)
Target (PFDavg): —
Approx. RRF: —
Mode: Low demand
Outcome code: —
What do C/F/P/W mean?
| Parameter | Level | Typical interpretation |
|---|---|---|
| C — Consequence | C1 | Slight to moderate (reversible) injury |
| C2 | Serious irreversible injury or single fatality | |
| C3 | Life‑threatening injuries; one or more fatalities | |
| C4 | Catastrophic; multiple fatalities | |
| F — Frequency / exposure | F1 | Seldom/less often and/or exposure time is short |
| F2 | Frequent to continuous and/or exposure time is long | |
| P — Probability of hazardous event | P1 | Very low; possible only in rare situations |
| P2 | Relatively high; quite possible | |
| W — Possibility of avoidance | W1 | Possible under specific conditions (detectable/avoidance feasible) |
| W2 | Hardly possible to avoid once initiated |
These definitions are simplified for on-screen use. Always follow your internal risk policy and the exact wording in IEC 61508/61511.
SIL targets (low vs high demand)
| SIL | Low demand (PFDavg) | High demand / Continuous (PFH) | Typical RRF (approx) |
|---|---|---|---|
| 1 | [1×10⁻², 1×10⁻¹) | [1×10⁻⁶, 1×10⁻⁵) | ×10 |
| 2 | [1×10⁻³, 1×10⁻²) | [1×10⁻⁷, 1×10⁻⁶) | ×100 |
| 3 | [1×10⁻⁴, 1×10⁻³) | [1×10⁻⁸, 1×10⁻⁷) | ×1000 |
| 4 | [1×10⁻⁵, 1×10⁻⁴) | [1×10⁻⁹, 1×10⁻⁸) | ×10000 |
Diagnostics & self-tests
No tests run yet.
