
Event Tree Analysis (ETA):
Furnace Flame-Out Scenarios
Expert Foreword
By Instrunexus
In the domain of Process Safety Management (PSM), we often say: "We do not manage luck; we manage barriers." The furnace is the heart of the refinery, but it is also a potential bomb. A flame-out scenario—where the flame extinguishes but fuel continues to flow—is one of the most critical hazards we face.
This analysis uses Event Tree Analysis (ETA) to quantify that risk. We aren't just looking at the machinery; we are looking at the probability of failure on demand (PFD). The data presented here (0.5/year frequency) suggests a standard industrial furnace operation, but the insights reveal how critical the interaction between the Burner Management System (BMS) and the physical Shut-Off Valves (SSOV) really is.
Crucial Insight
The difference between a nuisance trip and a Vapor Cloud Explosion (VCE) inside the firebox often comes down to milliseconds of response time and the reliability of a single solenoid valve.
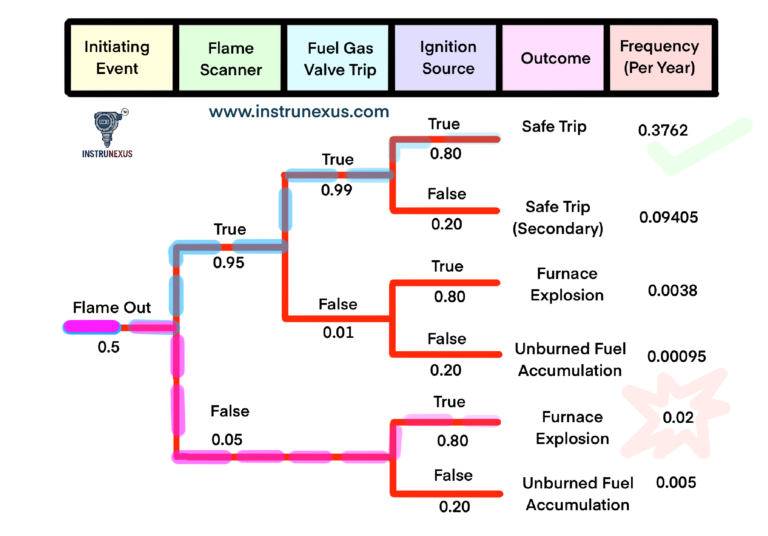
The Event Tree Structure
*Note: "Ignition Present" (0.80) creates explosions. "Ignition Absent" (0.20) creates accumulation hazards.
4. Mathematical Analysis & Logic
The mathematics of safety is based on conditional probability. We move from left to right across the tree. The frequency of any outcome is the product of the Initiating Event Frequency and the probabilities of the branches taken.
Path 1: The Safe Trip
The ideal response. The system works as designed.
IE (0.5) × Scanner✔ (0.95) × Valve✔ (0.99) × NoIgnit* (0.80)
*Note: In this specific model, the user data factors ignition probability even in success paths to account for all variables, though typically a successful valve closure precludes the ignition variable.
Path 2: Scanner Fail (Highest Risk)
"Running Blind." The flame is out, but fuel continues because the eye failed.
IE (0.5) × Scanner✖ (0.05) × Ignition✔ (0.80)
Frequency 1 in 50 years.
Path 3: Valve Failure
Scanner sees it, logic trips, but the valve is stuck mechanically.
IE (0.5) × Scanner✔ (0.95) × Valve✖ (0.01) × Ignition✔ (0.80)
Risk Simulator
Interactive ToolAdjust the reliability of your protection layers. See how investing in better maintenance (increasing reliability) drastically reduces explosion frequency.
Init. Event: 0.5/yr
Ignition Prob: 0.80
Calculated Risk Outcomes
Expert Deep Dive Analysis
Expanding the numbers into engineering reality. What actually happens in the field?
1. The Physics of "Flame-Out"
A flame-out is not simply the fire going out; it is the transition of a furnace from a combustion chamber to a fuel accumulation vessel. In a standard draft furnace, fuel gas flows at high pressure. If the oxidation reaction stops (the flame dies) but the fuel supply continues, the furnace volume fills with a flammable mixture.
The provided data indicates an Ignition Probability of 0.80. This is realistic for fired heaters because the refractory lining (firebrick) retains immense heat (often >1000°C) long after the flame is gone. This temperature is well above the Auto-Ignition Temperature (AIT) of Methane (537°C) or Hydrogen (500°C). Therefore, if fuel continues to enter, re-ignition is almost guaranteed, resulting in a detonation or high-speed deflagration.
2. The Detection Layer: Flame Scanners (0.95 Reliability)
The analysis assumes a 0.95 reliability (5% Probability of Failure on Demand - PFD). In SIL (Safety Integrity Level) terms, a single scanner often achieves SIL 1 or low SIL 2 performance.
- Technology: Modern scanners use Ultraviolet (UV) or Infrared (IR) detection. UV is good for gas flames; IR is better for oil/coal or smoky environments.
- Common Failure Modes (The 5%):
- Sighting Blockage: Dirty lenses or obstructed sight tubes are the #1 cause of failure.
- "Friendly Fire": The scanner picking up a flame from an adjacent burner (background discrimination failure).
- Component Fatigue: UV tubes age and lose sensitivity.
3. The Final Element: Trip Valves (0.99 Reliability)
The Fuel Gas Trip Valve is the physical barrier. A 0.99 reliability (1% failure rate) is typical for a single solenoid-operated valve. However, in high-risk applications, this is often insufficient.
To improve this 0.99 figure, industry standards (like API 556) often recommend a Double Block and Bleed (DBB) arrangement. Two valves in series drastically reduce the probability of "fail to close" (0.01 × 0.01 = 0.0001). The single valve model used in this ETA highlights why redundancy is critical. If that one valve sticks due to sludge or solenoid burnout, the system is defenseless.
4. Linking ETA to LOPA (Layer of Protection Analysis)
This Event Tree is the "Consequence" side of a Bow-Tie diagram. In a LOPA study, we would take the outcome frequency (e.g., Explosion = 0.0238/year) and compare it to the corporate Risk Acceptance Criteria (RAC).
Most major energy companies have a RAC for a single fatality event around 10-4 (1 in 10,000 years). The calculated frequency here is roughly 2.3 × 10⁻² (1 in 43 years).
Conclusion: This risk gap (Two orders of magnitude) is unacceptable.
This ETA proves that a single scanner and single valve are likely insufficient for this furnace. The safety study would recommend: 1. Redundant Scanners (2oo3 voting). 2. Double Block and Bleed Valves. 3. Proof testing intervals to be shortened.