In the intricate world of process industries, from sprawling chemical plants to the precise operations of a pharmaceutical facility, maintaining control over fluid flow is paramount. The roadmap to understanding and managing this critical aspect of any process lies within a dense and detailed document: the Piping and Instrumentation Diagram (P&ID). For engineers, operators, and technicians, the ability to fluently read and interpret a P&ID, especially concerning flow instruments, is not just a valuable skill—it’s a fundamental necessity for safe and efficient plant operation.
This comprehensive blog post will serve as your guide to demystifying P&IDs for flow instruments. We will delve into the essential symbols, decipher the tagging and numbering conventions, and walk through the logic of flow control loops. By the end of this guide, you’ll be equipped to confidently navigate these complex diagrams and understand the story they tell about the movement of fluids within a process.
What is a P & ID and Why is it Crucial?
A Piping and Instrumentation Diagram is a detailed, schematic representation of a process plant. It’s more than just a drawing; it’s a technical document that illustrates the interconnection of process equipment and the instrumentation used to control the process. Unlike a simpler Process Flow Diagram (PFD), which shows the broader strokes of a process, a P & ID provides a granular view, including:
- All piping, including sizes, materials, and insulation.
- All equipment, such as pumps, vessels, heat exchangers, and columns.
- All instrumentation, including sensors, transmitters, controllers, and valves.
- Control loops and logic that govern the process.
- Safety systems and interlocks.
For flow instruments, the P & ID is the definitive source of truth. It reveals not only what is being measured but also how it’s being measured, where the measurement is taking place, and how that information is used to control the process. A clear understanding of P&IDs is therefore essential for:
- Process Understanding: Gaining a deep understanding of how a plant or system operates.
- Troubleshooting: Quickly identifying the source of a problem when a flow-related issue arises.
- Maintenance: Safely isolating equipment and instruments for repair or replacement.
- Safety: Recognizing and understanding the safety instrumented systems (SIS) in place to prevent hazardous situations.
- Process Improvement: Identifying opportunities to optimize flow control and improve efficiency.
Deconstructing the P&ID: The Language of Symbols
P&IDs communicate through a standardized language of symbols, primarily governed by the International Society of Automation (ISA) standard ISA-5.1. Let’s break down the key symbols you’ll encounter when focusing on flow instrumentation.
1. Instrument Bubbles: The Heart of the Information
The most fundamental element on a P&ID for an instrument is the “bubble” or circle. The lines within and around this circle tell you where the instrument is located and how it’s connected.
Block Diagram 1: Instrument Location Symbols
- No Line (Field Mounted): The instrument is physically located in the process area, close to the equipment it’s monitoring. Operators typically need to go into the field to read its output directly.
- Solid Line (Control Room Mounted): The instrument is located in a central control room, accessible to the plant operators. This is common for critical process indicators and controllers.
- Dashed Line (Mounted Behind the Panel): The instrument is located behind the main control panel, not immediately visible or accessible to the operator. This is often used for auxiliary logic components.
- Double Solid Line (Auxiliary Location): The instrument is located in a secondary or local control panel, not the main control room.
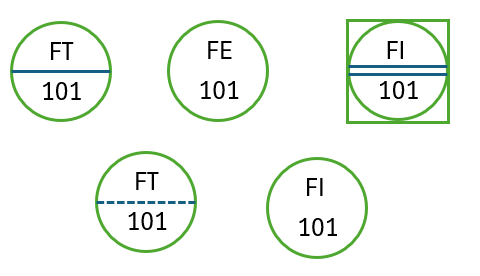
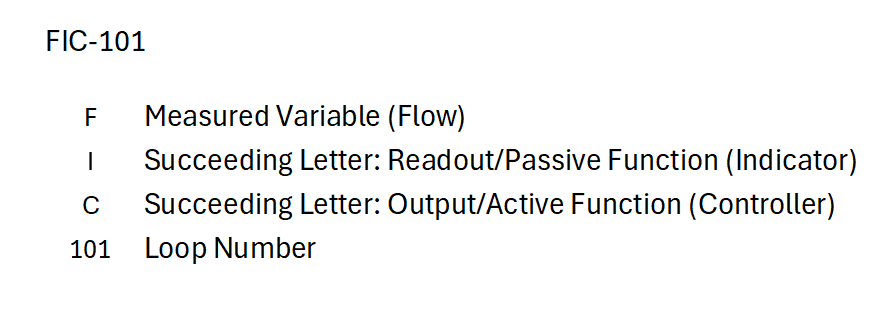
2. Instrument Tagging: Decoding the Letters and Numbers
Inside each instrument bubble is a combination of letters and numbers known as the instrument tag. This tag provides a unique identifier for the instrument and describes its function. The ISA-5.1 standard dictates the meaning of these letters.
For flow instruments, the first letter is almost always ‘F’. The succeeding letters describe the function of the instrument.
Block Diagram 2: Anatomy of an Instrument Tag
3. Flow Element Symbols: The Source of the Measurement
The P&ID will also show the specific type of flow element being used. The symbol for the flow element is typically connected to the instrument bubble representing the flow transmitter.
Block Diagram 3: Common Flow Element Symbols
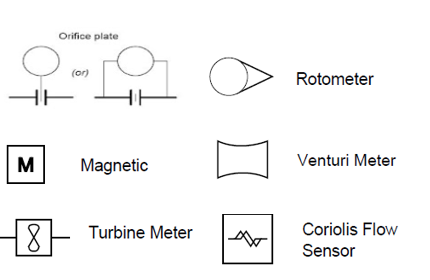
- Orifice Plate: A simple and common differential pressure flow meter.
- Venturi Meter: Creates a lower pressure drop than an orifice plate, making it more energy-efficient.
- Turbine Meter: A mechanical meter where the rotation of a turbine is proportional to the flow rate.
- Magnetic Flow Meter (Magmeter): Measures the flow of conductive liquids based on Faraday’s law of induction.
- Coriolis Flow Meter: A highly accurate meter that measures mass flow directly.
- Rotameter: A variable area flow meter where a float rises in a tapered tube to indicate the flow rate.
4. Line and Signal Symbols: Connecting the Dots
The lines on a P&ID represent the connections between instruments and equipment. The type of line indicates the type of signal being transmitted.
- Process Line: Represents the main piping carrying the process fluid.
- Pneumatic Signal: A signal transmitted using compressed air.
- Electrical Signal: A signal transmitted as a current (e.g., 4-20 mA) or voltage.
- Data Link (DCS/PLC): A digital communication link to a Distributed Control System (DCS) or Programmable Logic Controller (PLC).
- Capillary Tubing: Used for transmitting pressure from a remote seal to a transmitter.
Tracing a Flow Control Loop: A Step-by-Step Guide
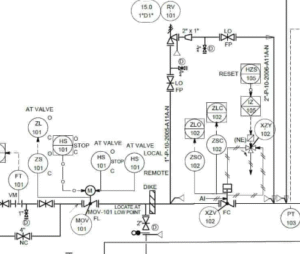
Now that we understand the individual components, let’s put it all together and trace a typical flow control loop on a P&ID. A flow control loop is a system designed to maintain a desired flow rate.
Block Diagram 5: A Simple Flow Control Loop (FIC-101)
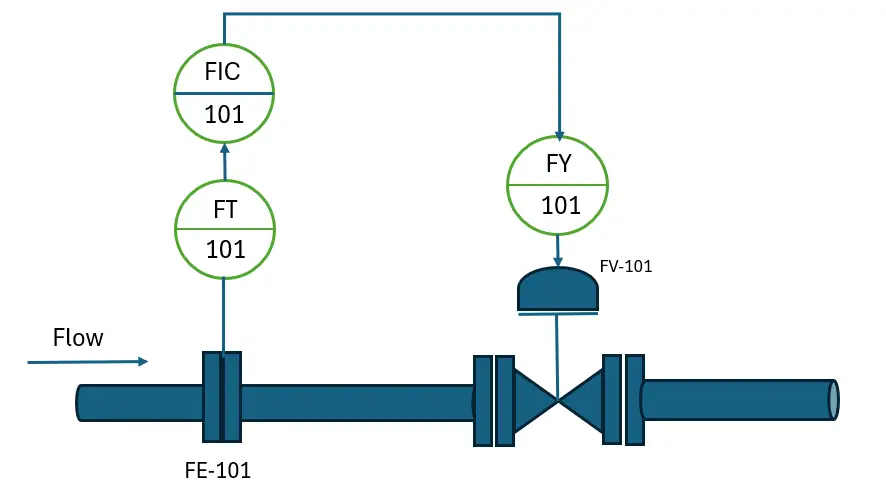
Let’s break down this example:
The Process: A fluid is flowing through a process line from an upstream source to a downstream destination.
The Sensing Element (FE-101): An orifice plate (
FE-101) is installed in the line. This creates a pressure drop that is proportional to the square of the flow rate.The Transmitter (FT-101): A flow transmitter (
FT-101) is connected to the orifice plate. It measures the differential pressure, calculates the flow rate, and converts it into an electrical signal (indicated by the dashed line).FT-101is field-mounted.The Controller (FIC-101): The electrical signal from
FT-101is sent to a Flow Indicating Controller (FIC-101). The solid line around the bubble indicates that this controller is located in the control room. The ‘I’ inFICtells us that it also displays the flow rate to the operator. The controller compares the measured flow rate fromFT-101to a setpoint entered by the operator.The Logic/Converter (FY-101): The output of the controller (
FIC-101) is an electrical signal. This signal is sent to a current-to-pneumatic (I/P) converter, represented byFY-101. The ‘Y’ indicates a relay or converter. This device converts the electrical control signal into a pneumatic signal.The Final Control Element (FV-101): The pneumatic signal from
FY-101actuates the flow control valve (FV-101). This valve physically opens or closes to adjust the flow of the fluid in the pipeline, thereby bringing the measured flow rate back to the desired setpoint.
By following these connections, we have successfully interpreted the entire flow control loop, understanding how the flow is measured, controlled, and manipulated.
Advanced Concepts and Considerations
While the basics provide a strong foundation, P&IDs can contain more complex information. Here are a few advanced concepts to be aware of:
- Interlocks: These are safety features that automatically shut down a part of the process under certain conditions. On a P&ID, they are often represented by diamond-shaped symbols with logic descriptions. For example, a high-flow alarm (
FAH-101) might trigger an interlock to close an upstream valve. - Ratio Control: In some processes, the flow of one stream needs to be maintained at a specific ratio to another. This is represented by a ratio controller (
FFC). - Cascade Control: A more complex control strategy where the output of one controller (the master) becomes the setpoint for another controller (the slave). For example, a level controller on a tank might adjust the setpoint of a flow controller on the inlet line.
- Batch Processes: P&IDs for batch processes will often include symbols for sequencers and timers that control the flow for specific durations.
Best Practices for Reading P&IDs for Flow Instruments
- Always start with the legend sheet: Every set of P&IDs should have a legend sheet that defines all the symbols and abbreviations used.
- Trace the main process lines first: Get a feel for the overall flow of the process before diving into the details of the instrumentation.
- Follow the loop numbers: Use the loop numbers to connect all the instruments that work together in a single control strategy.
- Pay attention to the notes and callouts: These often contain critical information about operating conditions, materials of construction, and safety precautions.
- Don’t be afraid to ask questions: If you’re unsure about a symbol or a part of the diagram, consult with a more experienced engineer or operator.
Conclusion: Unlocking Process Insights
Piping and Instrumentation Diagrams are the definitive language of the process industry. For anyone involved in the design, operation, or maintenance of a plant, the ability to read and interpret P&IDs for flow instruments is a non-negotiable skill. By understanding the standardized symbols, decoding the instrument tags, and tracing the logic of control loops, you can unlock a wealth of information about how a process is designed to function.
This guide has provided a comprehensive overview, from the fundamental building blocks to the intricacies of flow control. The next time you encounter a P&ID, you’ll be better equipped to approach it not as a confusing collection of lines and circles, but as a detailed and informative map that guides you through the heart of the process. With practice and a keen eye for detail, you’ll soon be fluent in the language of P&IDs, a skill that will prove invaluable throughout your career in the dynamic world of process control.