
Partial Stroke Test: Implementation, Compliance, and Reliability Optimization
1. Executive Summary
In the high-stakes domain of process safety, the reliability of the final control element—typically an Emergency Shutdown (ESD) valve—stands as the most critical variable in the performance of a Safety Instrumented Function (SIF). Unlike logic solvers and sensors, which benefit from continuous electronic self-diagnostics and redundant architectures, the ESD valve is a mechanical device that often sits dormant for extended periods. This dormancy creates a breeding ground for time-dependent failure mechanisms such as stiction, cold welding, and pneumatic path degradation, which are historically responsible for the majority of Safety Instrumented System (SIS) failures on demand.
Partial Stroke Testing (PST) has evolved from a niche maintenance technique into a cornerstone of modern functional safety management strategies. By moving the valve a small percentage of its travel without disrupting the process flow, operators can verify the mechanical integrity of the final element, thereby converting a significant portion of “dangerous undetected” failures into “dangerous detected” failures. This transformation has profound implications for Safety Integrity Level (SIL) verification, allowing for the extension of full-stroke proof test intervals and potentially reducing the hardware fault tolerance requirements under IEC 61508 architectural constraints.
This comprehensive research report provides an exhaustive analysis of Partial Stroke Testing, grounded in the rigorous requirements of IEC 61511 Edition 2 and IEC 61508 Edition 2. It explores the physics of valve failure, the complex mathematical modeling required to accurately claim diagnostic credit, and the practical challenges of integrating PST into diverse control system architectures—from mechanical jammers to digital twins. Through detailed examination of vendor-specific implementations (Emerson, Siemens, Triconex, Metso, Rotork) and real-world case studies, this document serves as a definitive guide for functional safety engineers, reliability analysts, and operations managers seeking to optimize their safety lifecycle management.
2. The Physics of Final Element Reliability
2.1 The Dormancy Paradox
The fundamental challenge in SIS reliability is the “low demand” mode of operation. An ESD valve is designed to act only in the rare event of a process excursion. While a control valve modulates constantly, keeping its packing and trim free of static buildup, an ESD valve may remain in the fully open position for months or years. This static operation creates a unique reliability challenge: the probability of a valve failing to move on demand increases as a function of the time it remains stationary.
Reliability data from the Offshore Reliability Data (OREDA) handbook and the Center for Chemical Process Safety (CCPS) consistently highlights that final elements account for nearly 50% of all SIS failures. The failure mechanisms are primarily mechanical and tribological:
Stiction (Static Friction): The most prevalent failure mode. Over time, process fluids can penetrate the micro-gaps between the valve stem and packing, or the ball and seat. Polymerization, crystallization, or simple corrosion can bond these surfaces together. The force required to break this static bond (breakout torque) can eventually exceed the torque output of the actuator, rendering the valve “stuck”.
Cold Welding: In high-pressure or high-temperature applications, metal-to-metal contact points can experience localized diffusion bonding over long periods of immobility.
Elastomer Degradation: O-rings and seals in pneumatic actuators can take a “compression set,” losing their elasticity and sealing capability. When the valve is finally called to move, the actuator may leak air across the piston rather than building the necessary pressure differential.
Pneumatic Path Blockages: Solenoid Operated Valves (SOVs) are electromechanical devices that can suffer from “stick-slip” behavior due to lubricant drying or debris accumulation in the pilot ports. A coil burnout is fail-safe (de-energize to trip), but a mechanical jam in the spool valve is a dangerous failure.
2.2 The Limitations of Full Stroke Testing
Historically, the only definitive method to verify an ESD valve’s functionality was a Full Stroke Test (FST). This involves fully closing the valve, verifying tight shutoff, and reopening it. In a continuous process plant (e.g., refinery, petrochemical complex, LNG train), performing an FST presents severe operational challenges:
Process Interruption: Fully closing a main intake or outlet valve usually necessitates a unit shutdown, resulting in significant lost production revenue.
Bypass Risks: To test online, the valve must be bypassed. This introduces a procedural risk: if the bypass is left open after the test, the safety function is completely negated. The “human factor” in managing bypasses is a major contributor to safety incidents.
Mechanical Shock: Slamming a large valve shut at full speed (as in a trip test) places significant mechanical stress on the piping, supports, and valve internals. Frequent full stroking can accelerate wear, counterproductively reducing reliability.
Partial Stroke Testing emerged as the engineering solution to this dilemma. By moving the valve only 10% to 20% of its travel, the “breakout” capability is proven, confirming that the valve is not stuck and the actuator is functional, without disturbing the process flow or requiring a bypass.
3. The Regulatory Framework: IEC 61508 and IEC 61511
The implementation of PST is not merely a maintenance preference; it is a calculated engineering decision governed by international functional safety standards. A nuanced understanding of the interplay between IEC 61508 (manufacturing/device standard) and IEC 61511 (user/application standard) is essential for compliant PST strategies.
3.1 IEC 61508: Functional Safety of E/E/PE Systems
IEC 61508 provides the theoretical underpinning for PST through its definitions of failure modes and diagnostic metrics. It introduces the critical concepts of “Diagnostic Coverage” (DC) and “Safe Failure Fraction” (SFF), which are the mathematical levers by which PST improves a system’s SIL capability.
3.1.1 Diagnostic Coverage (DC) and Failure Decomposition
The standard classifies failures into four quadrants: Safe Detected (), Safe Undetected (), Dangerous Detected (), and Dangerous Undetected (). The primary goal of any diagnostic mechanism, including PST, is to shift failures from the category to the category.
IEC 61508 defines Diagnostic Coverage as the ratio of the detected dangerous failure rate to the total dangerous failure rate:
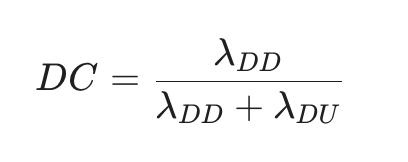
It is crucial to recognize that PST does not have 100% Diagnostic Coverage. While it effectively detects stiction and actuator force issues, it is blind to other failure modes:
Valve Seat Leakage: A valve may move 10% perfectly but fail to seal when fully closed due to seat erosion.
Full Travel Obstruction: An object lodged in the valve body at the 50% position would not be detected by a 10% stroke test.
Sheared Shaft (Downstream): If the position feedback is taken from the actuator rather than the valve element itself, a sheared shaft might allow the actuator to move while the ball/plug remains stationary.
Industry consensus, supported by technical reports like ISA-TR96.05.01, typically assigns a DC factor of 60% to 80% for PST, depending heavily on the valve type, service severity, and instrumentation configuration.
3.1.2 Safe Failure Fraction (SFF) and Architectural Constraints
The Safe Failure Fraction is a measure of the system’s propensity to fail safely or detect its own dangerous failures:
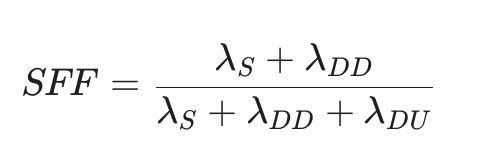
By implementing automated PST, the component increases significantly. This elevates the SFF. Under IEC 61508 Route 1H (Hardware Fault Tolerance), achieving a higher SFF can allow a subsystem to meet the architectural constraints for a higher SIL level without increasing hardware redundancy.
Example: A single valve (HFT=0) is a Type A subsystem. To achieve SIL 3 capability, it typically requires an SFF > 90% (Table 2 of IEC 61508-2). Without PST, a standard valve might have an SFF of 40-50%, limiting it to SIL 2 as a single device. By adding a smart positioner with automated PST that detects 70% of dangerous failures, the SFF may rise above 90%, allowing the single valve to meet SIL 3 architectural requirements (assuming systematic capability SC3 is also met).
3.2 IEC 61511: Safety Instrumented Systems for the Process Industry
IEC 61511 is the standard for end-users, focusing on the lifecycle from design to decommissioning. It translates the theoretical metrics of IEC 61508 into operational requirements.
3.2.1 Proof Testing Requirements (Clause 16)
Clause 16 of IEC 61511 governs “SIS Operation and Maintenance.” It mandates periodic proof testing to reveal undetected faults. A critical distinction in the standard is the role of PST versus FST.
Complement, Not Replacement: IEC 61511 implies that PST is a diagnostic test, not a full proof test. Because PST cannot detect 100% of failures, the Full Stroke Test is still required to reveal the remaining “Dangerous Undetected” failures (e.g., leakage). PST allows the intervalbetween FSTs to be extended, but it does not eliminate the need for them.
Written Procedures: Clause 16.2.8 and 16.3.1.1 explicitly state that “Periodic proof tests shall be conducted using a written procedure to reveal undetected faults.” This procedure must include the correct operation of the sensor, logic solver, and final element. For PST, this means the procedure must specify the pass/fail criteria (e.g., travel deviation, stroke time) and the actions to be taken upon failure.
3.2.2 PFDavg and the “Sawtooth” Curve
The Average Probability of Failure on Demand (PFDavg) is the key reliability metric for low-demand loops. The implementation of PST alters the PFDavg calculation by effectively creating two testing intervals: the frequent PST interval () and the infrequent FST interval ().
The simplified PFDavg equation becomes a sum of two parts:
The failures detected by PST, which only accumulate over the short .
The failures not detected by PST, which accumulate over the longer .
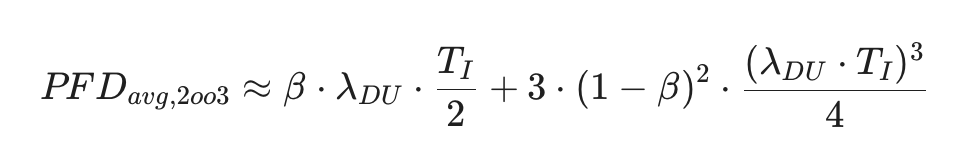
Since (e.g., 1 month) is much smaller than (e.g., 5 years), the first term becomes negligible. The dominant factor is the second term. Therefore, the benefit of PST is limited by the factor . If DC is 70%, the PFDavg is roughly 30% of what it would be without PST. This mathematical reality means there are diminishing returns to increasing PST frequency; testing daily offers little PFDavg benefit over testing monthly.
4. Technical Implementation Methodologies
The industry has developed a spectrum of technologies to perform PST, ranging from simple mechanical hardware to sophisticated digital integration. Each approach balances cost, complexity, and diagnostic capability.
4.1 Mechanical Limiting (Jammers and Collars)
The simplest form of PST involves physically restricting the valve’s movement.
Technology: Devices like the Netherlocks FAITH (Fail Action Integrity Test Handling) system or simple valve jacks are mounted on the actuator. A key or pin is inserted to mechanically block the valve stem from moving past a set point (e.g., 20%).
Procedure: An operator goes to the field, inserts the blocking mechanism, and manually trips the solenoid. The valve moves until it hits the hard stop. The operator visually confirms movement and then resets the solenoid.
Advantages:
Zero Spurious Trip Risk: The valve is physically prevented from closing fully, eliminating the risk of process interruption due to overshoot.
Simplicity: No software or complex electronics are required.
Disadvantages:
High OPEX: Requires personnel to travel to the valve, which may be in hazardous or remote locations.
Bypass of Safety: During the test, the valve is physically blocked. If a genuine safety demand occurs while the jammer is inserted, the valve cannot close. This temporary unavailability must be modeled in the availability calculations.
Limited Diagnostics: It yields only binary (pass/fail) results. It cannot measure friction trends or breakout torque changes.
4.2 Solenoid Pulsing
This method utilizes the existing Solenoid Operated Valve (SOV) to initiate movement.
Technology: The logic solver is programmed to de-energize the SOV for a very short duration (pulse), typically milliseconds.
Procedure: The pulse causes the actuator to start venting. Before the valve travels too far, the SOV is re-energized. Position feedback (limit switch or transmitter) confirms movement.
Advantages: Low CAPEX (uses existing hardware).
Disadvantages: High risk of spurious trips. If the valve moves faster than expected (e.g., due to process pressure changes) or if the SOV sticks in the vent position, the valve may fully close. The “sweet spot” for the pulse width is difficult to tune and may drift over time.
4.3 Smart Positioners (Digital Valve Controllers)
The industry standard for high-integrity PST is the digital valve controller (DVC).
Technology: Devices such as the Emerson Fisher FIELDVUE DVC6200 SIS, Metso Neles ValvGuard, or Siemens SIPART PS2 are microprocessor-based positioners designed specifically for safety applications.
Procedure: The positioner receives a digital command (via HART, Fieldbus, or local button). It takes control of the pneumatic pressure, slowly ramping it down to achieve a precise target position (e.g., 10% movement). It continuously monitors the valve position.
Advantages:
Closed-Loop Control: The positioner actively controls the travel, virtually eliminating overshoot risk.
Abort Criteria: If the valve sticks (requires excessive pressure drop) or moves too fast, the positioner automatically aborts the test to prevent a trip.
Diagnostic Richness: These devices capture “Valve Signatures”—plots of pressure vs. travel—which allow engineers to calculate friction, spring rate, and seat load. This enables predictive maintenance.
Safety Priority: The device is transparent to the safety signal. If the logic solver commands a trip (0V/4mA), the positioner immediately dumps all air, overriding any active test.
4.4 Electro-Hydraulic Solutions
For high-torque applications (e.g., large pipeline valves), electro-hydraulic actuators are used.
Technology: Rotork Skilmatic and similar actuators use an internal hydraulic pump and spring return.
Implementation: PST is performed by relieving hydraulic pressure via a solenoid to allow the spring to drive the valve. The hydraulic unit’s internal electronics monitor the position and pressure, providing similar diagnostic capabilities to pneumatic smart positioners but adapted for hydraulic physics.
5. Vendor-Specific Implementation Architectures
Successful PST implementation requires integrating the field device with the Safety Logic Solver. Different vendors offer unique architectures to achieve this.
5.1 Emerson: DeltaV SIS and Fisher FIELDVUE
Emerson promotes an integrated “Smart SIS” approach.
Hardware: Fisher DVC6200 SIS digital valve controller mounted on the valve. DeltaV SIS Logic Solver with Electronic Marshalling (CHARMs).
Logic Integration: The DeltaV SIS system includes a dedicated
LSDVC(Logic Solver Digital Valve Controller) function block. This block communicates natively with the DVC6200 via the HART pass-through capability of the LS CHARM. It can trigger the PST and receive discrete status feedback (Test Active, Test Pass, Test Fail, Alert) directly into the safety logic without external multiplexers.Software: AMS ValveLink software is used for detailed configuration and to view the valve signature curves. The integration allows the PST to be scheduled automatically or initiated by an operator faceplate on the DeltaV HMI.
5.2 Siemens: SIMATIC PCS 7 and SIPART
Siemens utilizes its PCS 7 process control system with F-Systems (Fail-Safe) libraries.
Logic Integration: The
F_PSTfail-safe function block is part of the Advanced Process Library (APL). This block manages the PST sequence, monitoring the “feedback time” and “position tolerance.” It provides outputs for “Test Running,” “Error,” and “Maintenance Required.”Diagnostics: SIMATIC PDM (Process Device Manager) is used to access the detailed diagnostics of the SIPART PS2 positioner. The system supports Condition Monitoring Library (CML) blocks to visualize valve friction trends on the operator station.
5.3 Triconex (Schneider Electric): Safety Validator and TriStation
Triconex, a market leader in stand-alone safety controllers, focuses on rigorous validation.
Logic Integration: In TriStation 1131, engineers configure function blocks to drive the PST. Since Triconex often interfaces with third-party valves, it may use digital outputs to trigger a positioner’s binary input or use HART-enabled analog output modules (TCM) to send commands.
Validation: The “Triconex Safety Validator” tool allows for automated testing of the PST logic during the FAT (Factory Acceptance Test) and periodic re-validation. It ensures that the application logic correctly handles the PST sequence and does not inhibit the safety function.
5.4 Rockwell Automation: PlantPAx and Trusted/AADvance
Rockwell leverages its PlantPAx distributed control system architecture.
Logic Integration: Add-On Instructions (AOIs) such as
P_ValveSOare used to manage the valve. These AOIs have built-in interfaces for PST configuration (stroke percentage, test interval).HMI: The system provides pre-engineered faceplates (Global Objects) that allow operators to initiate PST and view “Pass/Fail” status and “Time to Last Test” directly from the HMI, integrating the safety data with process operations.
5.5 Metso (Valmet): Neles ValvGuard
Metso offers a unique hardware solution to the “spurious trip” fear.
Hardware: The Neles ValvGuard VG9000 is a safety solenoid/partial stroke test device.
Spurious Trip Prevention: Metso introduced a “PST-only” version (often distinguished by a green cover) that is powered by the DCS analog signal (4-20mA) but is incapable of fully venting the actuator to 0 pressure. It can only reduce pressure enough to perform the test. The actual safety trip must be handled by a separate, series-wired solenoid. This hardware-based limitation provides absolute assurance against spurious trips caused by the PST device itself.
6. Reliability Modeling and The “Credit” Paradox
Accurately quantifying the benefit of PST is one of the most contentious areas in functional safety engineering. It requires a sophisticated understanding of failure rate decomposition.
6.1 Decomposing Failure Rates (FMEDA)
A Failure Modes, Effects, and Diagnostic Analysis (FMEDA) breaks down a device’s failure rates. When PST is applied, the failure distribution changes.
Example (Generic Air Operated Ball Valve):
(Total, without PST): 1980 FITs (Failures In Time, hours).
With PST: The analysis identifies that 880 FITs of these failures (e.g., stem stiction, actuator spring break) are detectable by monitoring valve movement.
New Rates:
(Dangerous Detected) = 880 FITs.
(Dangerous Undetected) = 1100 FITs.
Result: The effective used in the PFDavg calculation drops from 1980 to 1100, a 44% reduction. This is the direct reliability benefit.
6.2 The Proof Test Coverage (Cpt) Paradox
A critical insight often overlooked is that implementing PST reduces the effectiveness (Coverage) of the Full Stroke Test.
Scenario Without PST: The annual FST detects stiction, spring failure, AND leakage. It might have a coverage (Cpt) of 95% relative to the total failure rate.
Scenario With PST: The PST runs monthly and detects stiction and spring failure continuously. When the technician performs the annual FST, the only failures left to find are the ones PST missed (e.g., leakage).
The Paradox: The FST finds 100% of the remaining failures, but relative to the total failure rate (which includes the ones already found by PST), its unique contribution is smaller.
If PST detects 44% of failures, and FST detects those 44% plus an additional 30% (leakage), the incremental value of the FST is lower.
Implication: When modeling in software like exSILentia, one cannot simply check the “PST” box AND keep the “FST Coverage” at 95%. The FST coverage factor must be adjusted to reflect that it is now searching for a smaller subset of latent faults. Failing to do so results in “double dipping” the credit and calculating a dangerously optimistic safety level.
7. Risks, Limitations, and Mitigation Strategies
7.1 Spurious Trips
The fear of spurious trips—accidentally shutting down the plant—is the primary barrier to PST adoption.
Causes: Positioner electronics failure, pneumatic relay sticking, operator error in manual tests, or aggressive PID tuning in the positioner causing overshoot.
Mitigation:
Abort Limits: Configure tight deviations in the smart positioner. If the valve travels >15% when the target is 10%, or if the pressure drops below a safety floor, the device must immediately re-pressurize.
Solenoid Redundancy: Use a 2oo2 (two-out-of-two) solenoid configuration. Both must trip to close the valve, significantly reducing the chance of a spurious trip during testing.
Pneumatic volume boosters: Ensure adequate air capacity so the valve can recover (re-open) quickly if it starts to drift.
7.2 Valve Seat Wear
Frequent stroking can degrade the valve seat, especially in soft-seated valves or applications with abrasive slurries.
Risk: Improving stiction reliability at the cost of leak-tightness.
Mitigation: Optimize test frequency. Daily testing is unnecessary; monthly or quarterly is usually sufficient to prevent stiction without causing excessive wear. Avoid PST in severe abrasive services unless the valve is specifically designed for modulation.
7.3 Data Overload and Alarm Fatigue
Automated PST generates vast amounts of data (signatures, logs).
Risk: If a PST fails (valve sticks), it generates an alarm. If this alarm is buried in a flood of process alarms, it may be ignored. A failed PST means the safety system is compromised.
Mitigation: Route PST failure alarms to a high-priority “Maintenance” or “System Health” category, distinct from process alerts. Integrate data into an Asset Management System (AMS) for “management by exception” reporting.
8. Operational Procedures and Documentation
Compliance with IEC 61511 Clause 16 requires rigorous documentation.
8.1 The Written Procedure (Template)
A compliant procedure for automated PST should include:
Prerequisites: Verify plant stability. Ensure no active bypasses on redundant legs.
Initiation: Trigger the test via the DCS faceplate.
Visual Verification (Optional but recommended): For critical valves, have an operator visually confirm movement during the initial commissioning tests.
Acceptance Criteria:
Travel: 10% 1%.
Stroke Time: < 10 seconds.
Friction: < Baseline + 20%.
Failure Response: If the test fails (Stick Alarm):
Do NOT attempt to re-stroke immediately (risk of full closure).
Declare the SIF “impaired.”
Initiate maintenance work order (MO) for urgent inspection.
Implement compensating measures (e.g., manned standby) if required by the Safety Requirement Specification (SRS).
8.2 Auditing and Reporting
Automated systems enable “touchless” compliance. The AMS (e.g., Emerson AMS, Siemens PDM) can automatically generate a PDF report for every test, timestamped and signed by the device ID. These reports should be archived to demonstrate compliance during regulatory audits (OSHA, HSE).
Table 1: Documentation Requirements Checklist
[ ] Date and Time of Test
[ ] Device Tag ID
[ ] Test Type (PST vs FST)
[ ] “As Found” Condition (Pass/Fail)
[ ] Key Variables (Breakout pressure, travel time)
[ ] Person/System Responsible
9. Case Studies: ROI and Safety Impact
9.1 Case Study: Refinery Turnaround Extension
Context: A major European refinery sought to extend its plant turnaround (TAR) interval from 3 years to 5 years to improve profitability. Challenge: The existing ESD valves were the limiting factor. Their PFDavg calculations (SIL 2) assumed a 1-year Proof Test Interval. Extending this to 5 years would degrade the loop to SIL 1, violating the safety requirements. Solution: The plant retrofitted 150 critical ESD valves with Metso Neles ValvGuard smart solenoids. Implementation:
PST Frequency: Monthly.
Diagnostic Credit: 70% of detected.
Result: The PFDavg calculation showed that with monthly PST, the remaining undetected failures accumulating over 5 years were low enough to maintain SIL 2. ROI: The ability to delay the TAR by 2 years resulted in an estimated $10 million in additional production revenue and maintenance savings. Additionally, the PST identified 3 stuck valves during operation, which were repaired during short maintenance windows, preventing potential fail-to-danger scenarios.
9.2 Case Study: Unmanned Offshore Platform
Context: An unmanned North Sea platform utilized High Integrity Pressure Protection System (HIPPS) valves. Challenge: Manual testing required helicopter mobilization, which was costly (>$50k per trip) and weather-dependent. Solution: Integration of PST via HART pass-through to the onshore control room using Emerson DeltaV SIS. Implementation:
Operators initiated PST remotely from shore.
Valve signatures were analyzed by reliability engineers onshore.
Result: Physical proof testing visits were reduced from quarterly to annually. The system provided early detection of hydrate formation in the valve body (indicated by increased friction), allowing for chemical injection adjustments before the valve froze completely.
10. Future Horizons: Digitalization and IIoT
The future of PST is moving beyond simple compliance and into the realm of predictive analytics.
Digital Twins: Creating a digital model of the valve based on its “birth certificate” signature. The operational PST data is continuously compared against this model to detect subtle degradation (e.g., spring fatigue) long before a functional failure occurs.
Machine Learning: Algorithms analyzing thousands of PST signatures across a fleet of valves to identify “bad actor” manufacturers or specific service conditions that lead to premature failure.
Automated Validation: Tools like the Triconex Safety Validator evolving to perform real-time, continuous auditing of the safety logic against the SRS, ensuring that the “as-configured” safety system never drifts from the “as-designed” intent.
11. Conclusion
Partial Stroke Testing represents a pivotal advancement in functional safety engineering. It transforms the ESD valve from a dormant liability into a transparent, managed asset. By rigorously applying the principles of IEC 61508 and IEC 61511, utilizing advanced digital positioners, and maintaining disciplined operational procedures, process owners can achieve a dual victory: enhancing the safety integrity of their facilities while simultaneously optimizing production uptime and maintenance costs.
However, success lies in the details. It requires resisting the temptation to “oversell” the credit, acknowledging the limitations of diagnostic coverage, and ensuring that the integration between the mechanical valve and the digital logic solver is seamless and robust. As the industry moves toward autonomous operations, PST will serve as the heartbeat of the safety system—a regular, automated pulse confirming that the final line of defense is ready to act.
12. List of Tables
Table 1: Comparative Analysis of PST Technologies
Table 2: Impact of PST on PFDavg and Proof Test Interval (Theoretical Example)
Note: Data derived from simplified 1oo1 equations using generic failure rates for a ball valve.