Risk Graph, LOPA, and FMEA: SIL Assessment Methods Compared
In the realm of industrial automation and process safety, ensuring the reliability of safety systems is not just a matter of compliance; it’s a critical imperative to protect human lives, the environment, and valuable assets. Central to this endeavor is the concept of the Safety Integrity Level (SIL), a measure of the performance required for a safety function. But how does one determine the appropriate SIL for a given hazard? This is where a variety of analytical methods come into play, each with its own strengths, weaknesses, and ideal applications. This comprehensive blog post delves into three of the most prominent SIL assessment methods: the Risk Graph, Layer of Protection Analysis (LOPA), and Failure Modes and Effects Analysis (FMEA). We will explore their methodologies, compare their approaches, and provide clarity on when to employ each to build a robust safety lifecycle.
The Foundation: Understanding SIL
Before we dissect the assessment methods, let’s briefly revisit the concept of SIL. Governed by international standards such as IEC 61508 and IEC 61511, a SIL is a discrete level (from 1 to 4) that indicates the degree of risk reduction a safety-instrumented function (SIF) must provide. A higher SIL signifies a greater risk and, consequently, a more stringent requirement for the reliability of the SIF. The goal of any SIL assessment is to identify the necessary risk reduction to bring an unacceptable process risk down to a tolerable level.
The Qualitative Approach: The Risk Graph Method
The Risk Graph method is a qualitative or semi-quantitative technique that provides a straightforward and visual way to determine the required SIL for a SIF. It’s often used as an initial screening tool or for less complex scenarios where a detailed quantitative analysis might be overkill. The method relies on a team of experts who evaluate a hazardous scenario based on a set of parameters.
Methodology of the Risk Graph
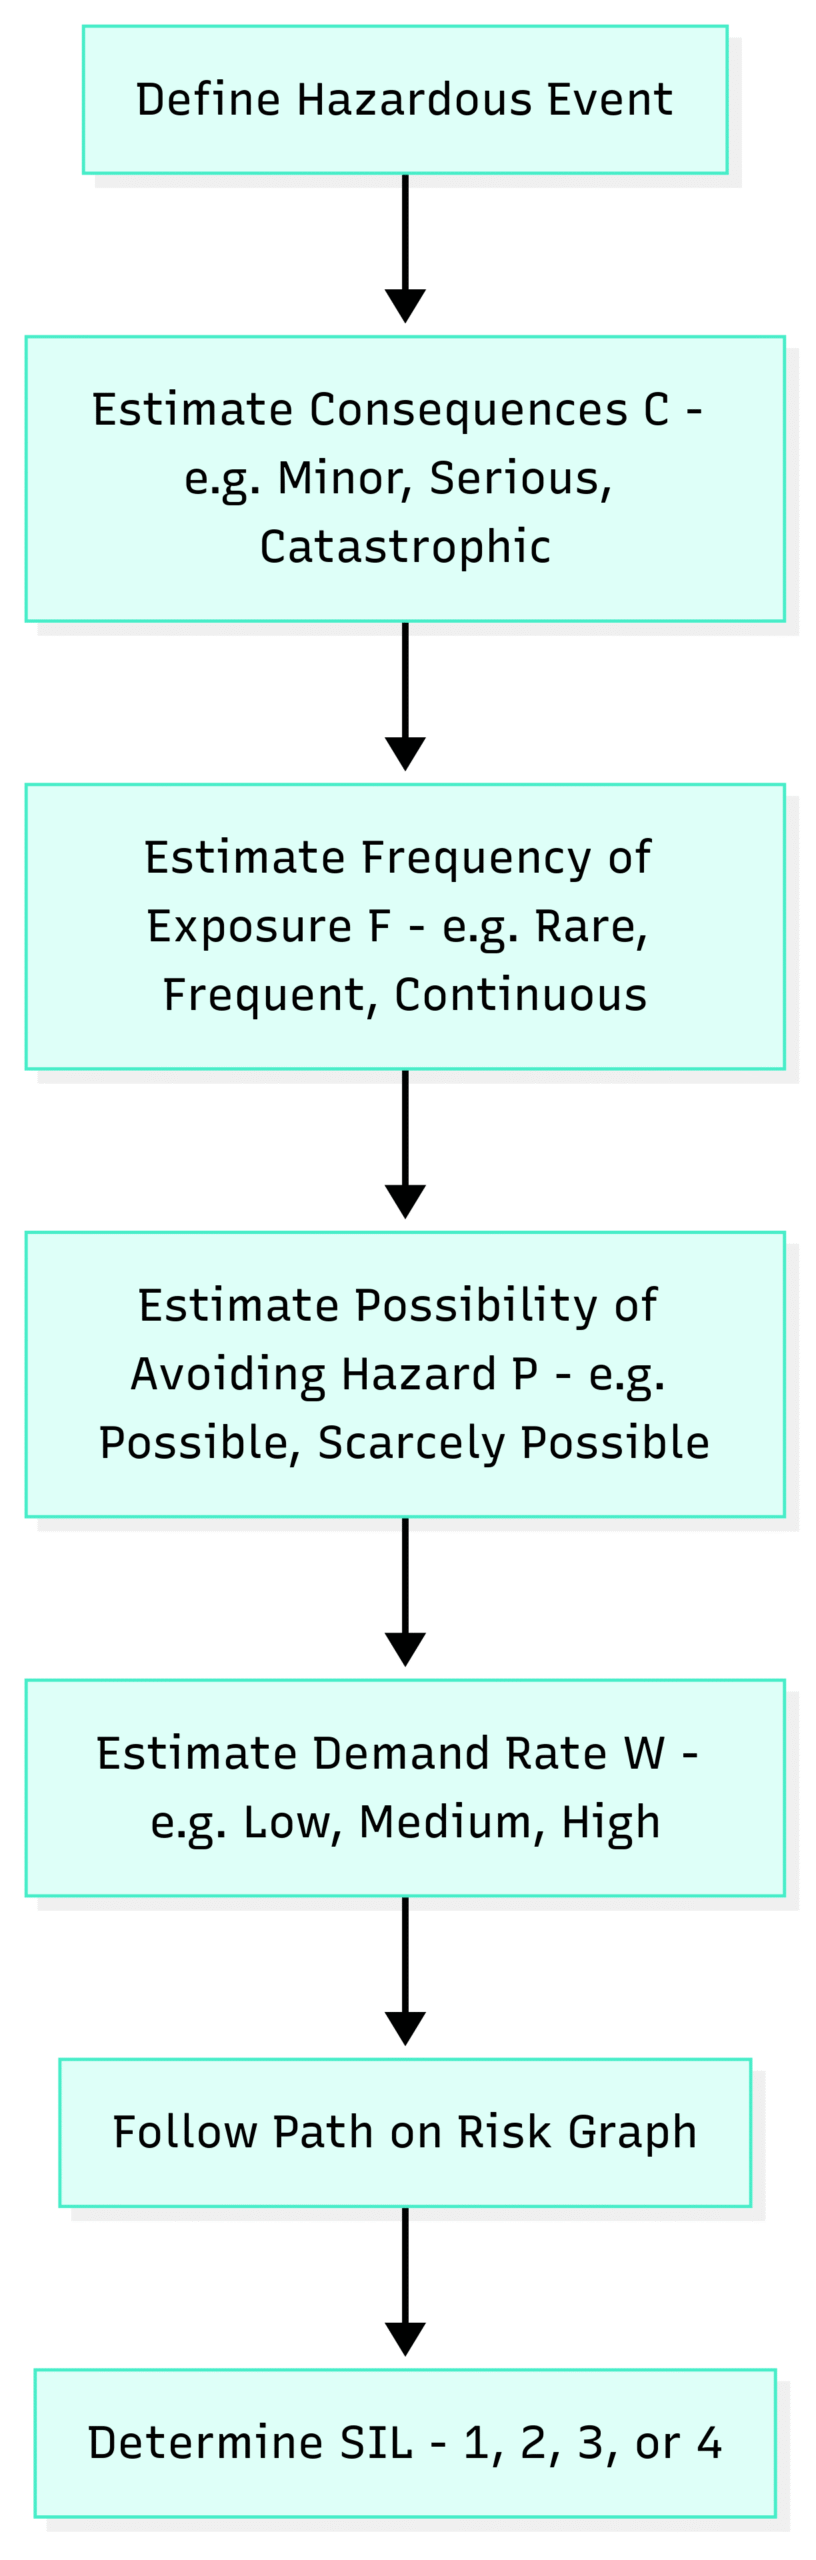
The core of the Risk Graph method is a decision-making process that considers several key factors related to the hazardous event:
Consequence (C): What are the potential consequences of the hazardous event? This can range from minor equipment damage to multiple fatalities or significant environmental impact. Consequences are typically categorized into several levels of severity.
Frequency of Exposure (F): How often are personnel exposed to the hazardous zone? Is it a continuous presence or a rare occurrence?
Possibility of Avoiding the Hazard (P): If the initial event occurs, is it possible for personnel to take action to avoid the hazardous consequence? For example, can they escape a slow-moving hazard?
Demand Rate (W): How often is the SIF expected to be called upon to act? This is the frequency of the initiating event that the SIF is designed to protect against.
The team systematically works through a predefined risk graph, which is essentially a decision tree. By selecting the appropriate category for each of the parameters (C, F, P, and W), a path is traced through the graph, ultimately leading to a required SIL.
Block Diagram of the Risk Graph Method
Strengths and Weaknesses of the Risk Graph
Strengths:
Simplicity and Speed: The Risk Graph is relatively easy to understand and apply, making it a quick method for SIL determination.
Visual Representation: The graphical nature of the method facilitates communication and understanding among team members with varying levels of expertise.
Qualitative Focus: It encourages a focus on the fundamental aspects of the risk without getting bogged down in complex calculations, which can be beneficial in the early stages of a project.
Weaknesses:
Subjectivity: The selection of categories for each parameter can be subjective and may lead to inconsistencies between different teams or assessors.
Limited Granularity: The discrete categories may not capture the nuances of a specific scenario, potentially leading to an over- or under-estimation of the required SIL.
Not Suitable for Complex Scenarios: For highly complex processes with multiple interacting hazards, the Risk Graph may oversimplify the situation and not provide a sufficiently rigorous analysis.
The Semi-Quantitative Powerhouse: Layer of Protection Analysis (LOPA)
Layer of Protection Analysis, or LOPA, is a semi-quantitative risk assessment method that provides a more detailed and structured approach to SIL determination than the Risk Graph. It has become one of the most widely used methods in the process industries due to its balance of rigor and efficiency. LOPA builds upon the information gathered during a Hazard and Operability (HAZOP) study and systematically analyzes the layers of protection that stand between a hazardous event and its ultimate consequence.
Methodology of LOPA
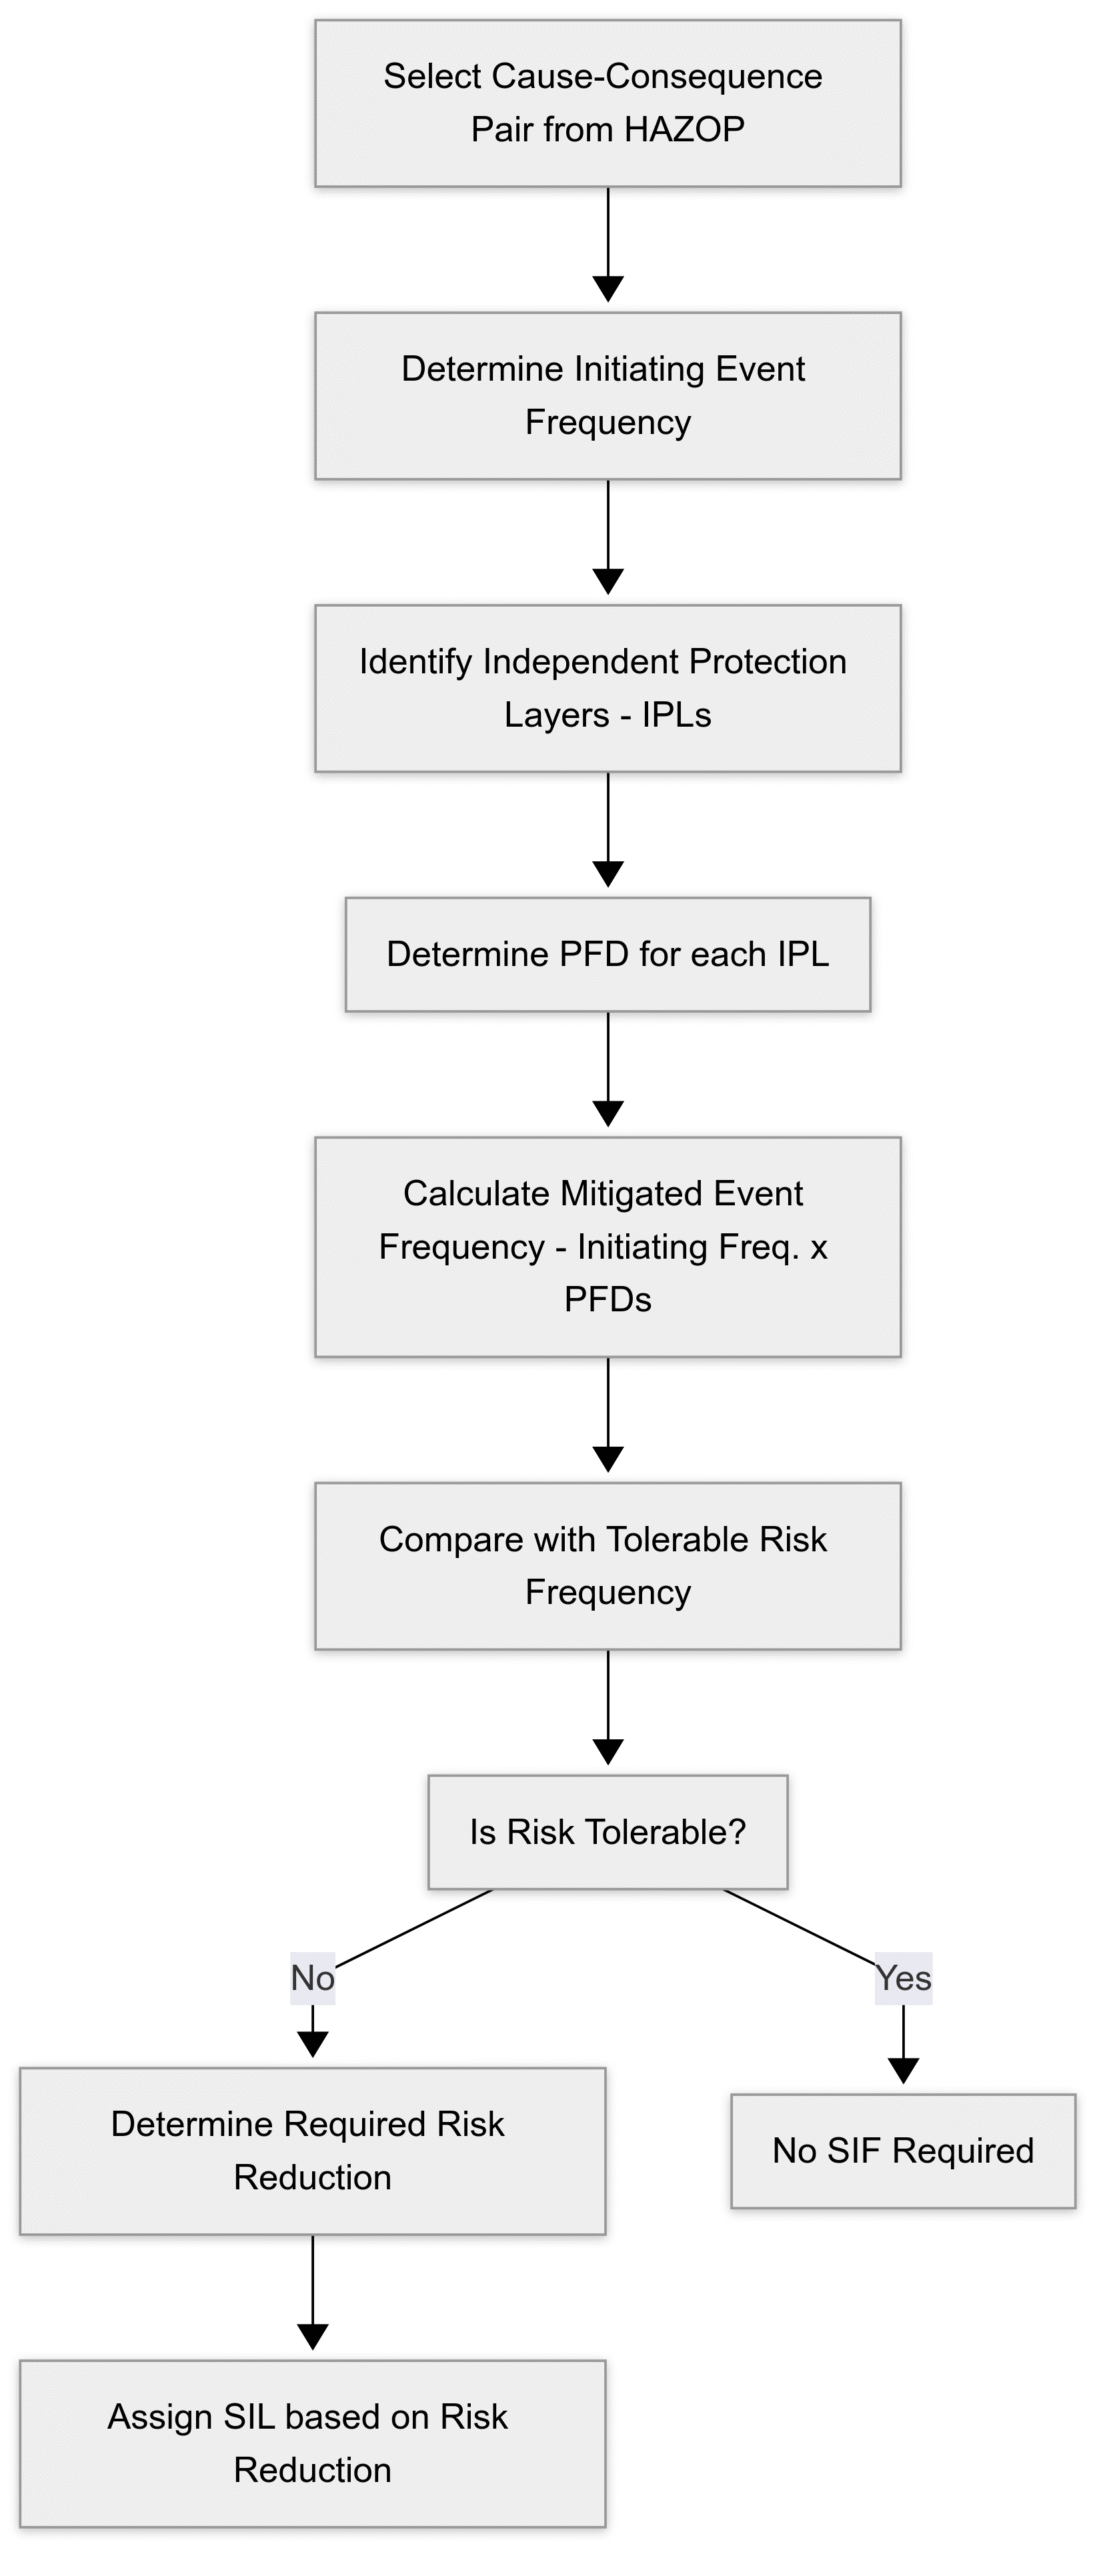
LOPA operates on a simple but powerful principle: for a catastrophic event to occur, all the independent protection layers (IPLs) designed to prevent it must fail on demand. The analysis involves the following steps:
Identify the Initiating Event and Consequence: Start with a specific cause-consequence pair, often identified from a HAZOP study.
Determine the Initiating Event Frequency: Quantify how often the initiating event is expected to occur (e.g., once every 10 years).
Identify Independent Protection Layers (IPLs): An IPL is a device, system, or action that is capable of preventing the consequence from occurring and is independent of the initiating event and other IPLs. Examples include basic process control systems (BPCS), alarms with operator intervention, and pressure relief valves.
Determine the Probability of Failure on Demand (PFD) for each IPL: For each identified IPL, assign a probability that it will fail to perform its function when required. These PFD values are typically standardized within an organization or taken from industry databases.
Calculate the Mitigated Event Frequency: Multiply the initiating event frequency by the PFDs of all the identified IPLs. This gives the frequency of the consequence occurring with the existing safeguards in place.
Compare with Tolerable Risk: Compare the mitigated event frequency to the organization’s predefined tolerable risk frequency for that specific consequence.
Determine the Required Risk Reduction: If the mitigated event frequency is higher than the tolerable risk, the difference represents the required risk reduction that must be provided by a new or improved SIF. This required risk reduction directly translates to a SIL requirement.
Block Diagram of the LOPA Method
Strengths and Weaknesses of LOPA
Strengths:
Rigor and Objectivity: LOPA introduces a level of quantitative analysis that reduces subjectivity compared to the Risk Graph. The use of standardized PFD values promotes consistency.
Focus on Independence: The strict criteria for what constitutes an IPL ensure a more realistic assessment of the existing safeguards.
Clear Documentation: The LOPA worksheet provides a clear and auditable trail of the SIL determination process.
Identifies Weaknesses: The analysis can highlight weaknesses in the existing layers of protection, leading to broader safety improvements.
Weaknesses:
Data Dependency: The accuracy of the LOPA results is heavily dependent on the quality and availability of initiating event frequency and PFD data.
Can Be Complex: For intricate scenarios with many IPLs and conditional modifiers, the analysis can become complex and time-consuming.
Potential for Misuse: If the rules for defining IPLs are not strictly followed, the analysis can produce misleading and non-conservative results.
The Bottom-Up Detective: Failure Modes and Effects Analysis (FMEA)
Failure Modes and Effects Analysis (FMEA) is a systematic, proactive method for evaluating a process or system to identify where and how it might fail and to assess the relative impact of different failures. While not a direct SIL determination method in the same way as Risk Graph or LOPA, FMEA is a powerful tool that plays a crucial role in the overall safety lifecycle and can provide critical input to SIL assessment.
Methodology of FMEA
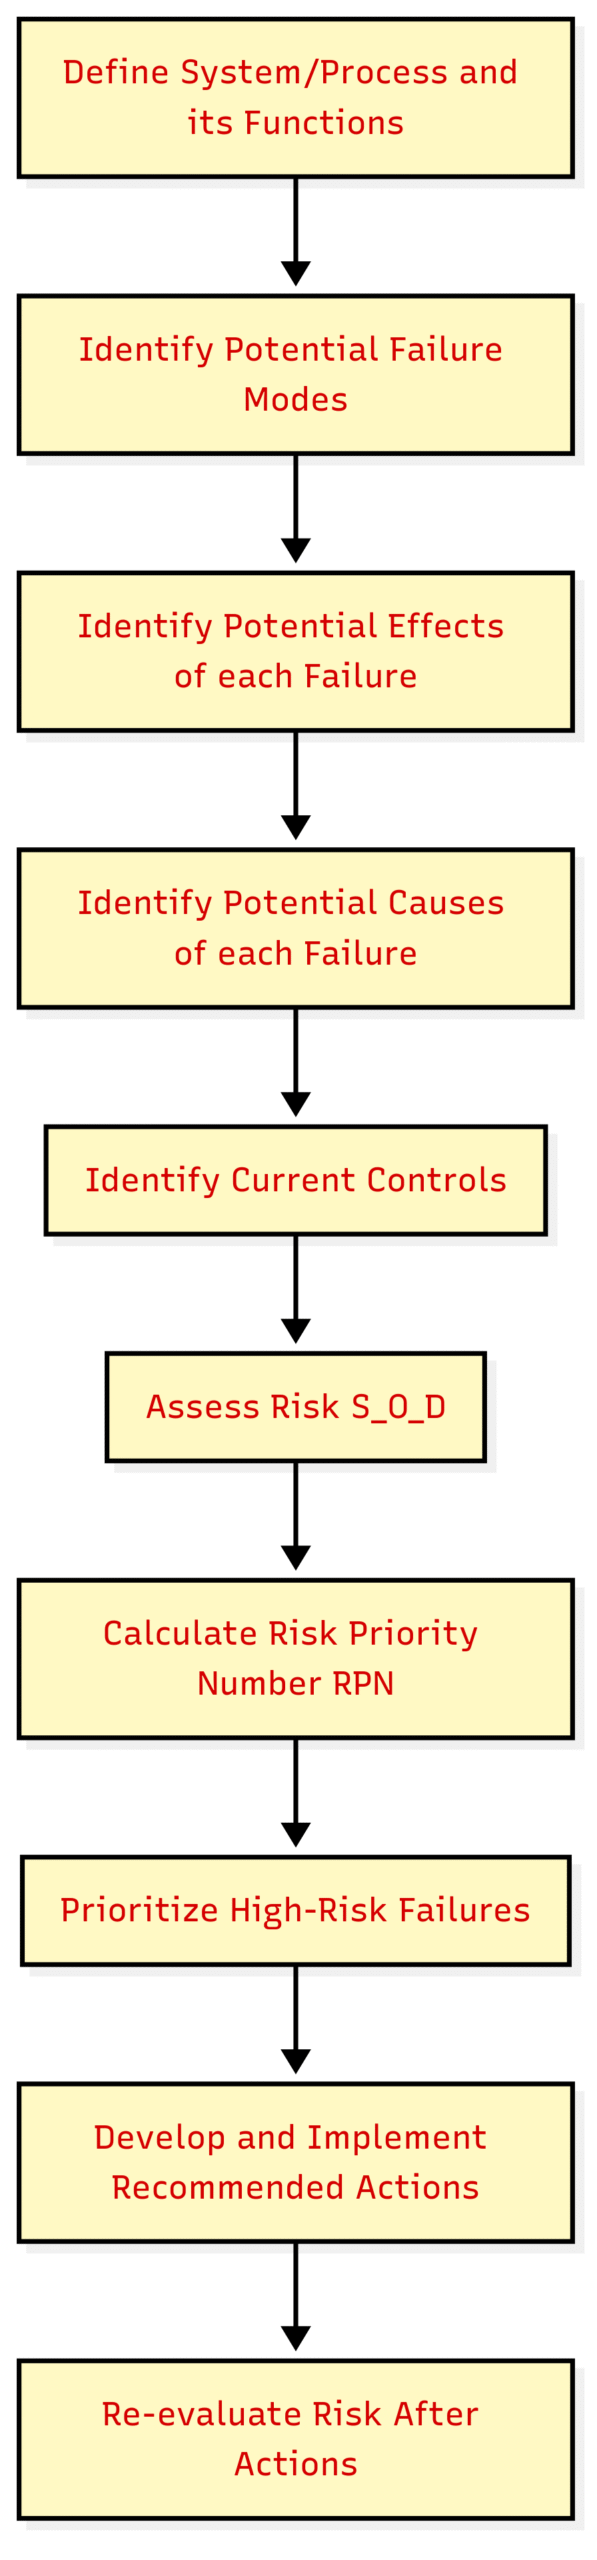
FMEA is a bottom-up approach that meticulously examines each component or step in a system. The process typically involves:
Define the System and its Functions: Clearly define the boundaries of the system being analyzed and the intended functions of each component.
Identify Potential Failure Modes: For each component, brainstorm all the ways it could potentially fail (e.g., a valve failing to open, a sensor providing a false reading).
Identify Potential Effects of Failure: For each failure mode, determine the immediate and ultimate consequences of that failure.
Identify Potential Causes of Failure: Determine the root causes that could lead to each failure mode.
Identify Current Controls: Document any existing controls or safeguards that are in place to prevent or detect the failure mode.
Assess the Risk: The risk associated with each failure mode is typically assessed by ranking three factors on a scale (e.g., 1 to 10):
Severity (S): How severe are the consequences of the failure?
Occurrence (O): How likely is the failure to occur?
Detection (D): How likely is the failure to be detected before it has a significant impact?
Calculate the Risk Priority Number (RPN): The RPN is calculated by multiplying the rankings for Severity, Occurrence, and Detection (RPN = S x O x D). A higher RPN indicates a higher-risk failure mode that requires attention.
Develop and Implement Actions: For high-RPN items, the team develops and implements actions to reduce the risk, such as design changes, improved maintenance procedures, or the addition of new safety functions.
FMEA’s Role in SIL Assessment
While FMEA doesn’t directly output a SIL, it is invaluable for:
Identifying Hazardous Events: The detailed analysis of failure modes can uncover potential hazardous events that might be missed in a higher-level assessment like a HAZOP.
Informing LOPA: The failure modes and their causes identified in an FMEA can serve as the initiating events for a LOPA.
Validating SIF Design: FMEA can be used to analyze the design of a SIF itself to identify potential failure modes within the safety function and ensure its robustness.
Improving the Reliability of Protection Layers: By identifying weaknesses in non-SIF protection layers, FMEA can lead to improvements that may reduce the reliance on a SIF, potentially lowering the required SIL.
Block Diagram of the FMEA Process
Head-to-Head: Risk Graph vs. LOPA vs. FMEA
Conclusion: Choosing the Right Tool for the Job
The choice between Risk Graph, LOPA, and FMEA is not a matter of one being definitively “better” than the others. Instead, the optimal approach depends on the specific context, the complexity of the system, and the stage of the safety lifecycle.
Use the Risk Graph for a quick, high-level assessment, especially in the early design phases or for simpler systems where a full-blown quantitative analysis is not warranted. It provides a valuable first pass at understanding the required level of safety.
Employ LOPA when a more rigorous and documented approach to SIL determination is needed. It is the go-to method for most process industry applications, offering a justifiable and consistent way to assign SILs to SIFs.
Leverage FMEA to perform a deep dive into the reliability of a system or its components. While not a direct SIL assignment tool, FMEA is an indispensable partner to both Risk Graph and LOPA, providing the foundational information needed for a comprehensive and accurate risk assessment. It is the detective that uncovers the hidden vulnerabilities that other methods might overlook.
Ultimately, a robust safety strategy often involves a combination of these methods. A Risk Graph might be used for an initial portfolio-wide screening, followed by LOPA for the higher-risk scenarios. FMEA can then be applied to critical components or to the SIFs themselves to ensure their design is inherently safe. By understanding the unique strengths and applications of each of these powerful analytical tools, organizations can build a multi-layered and resilient approach to process safety, ensuring that their safety systems are not just compliant, but truly effective in protecting what matters most.